Measurement & Analysis of Wheelchair Seat Cushions’ Shear Characteristics
Jonathan Akins, Patricia Karg, and David Brienza
Support Surfaces Laboratory – University of Pittsburgh
Pittsburgh, PA
ABSTRACT
Shear is a force recognized to increase the risk of pressure ulcer development. A new methodology was used to quantify interface shear stress and horizontal stiffness of eight wheelchair seat cushions. Shear stress ranged between 2.3 – 12.8 kPa. No correlation was found between the overall horizontal stiffness interface shear stress; however, a positive correlation was found between local horizontal stiffness and interface shear stress. The ROHO High Profile Single Compartment cushion had significantly lower interface shear stress (p<.000) and a flat HR70 open-cell polyurethane cushion had significantly higher interface shear stress (p<.013). Quantification of shear is essential in establishing wheelchair cushion design specifications for shear stress reduction in buttock soft tissue.
KEYWORDS
Pressure ulcers; shear stress; cushion stiffness; wheelchair seating
BACKGROUND
Pressure and shear created between wheelchair seat cushions and users are identified as extrinsic risk factors known to increase the risk of pressure ulcers (1). Wheelcahir users rely on their seat cushions to help maintain tissue integrity. A large amount of literature is available on the effects of pressure on tissue integrity, but relatively few studies have examined the effects of shear. Goossens (2) demonstrated the addition of shear applied to the sacrum lowered skin oxygen tension to levels associated with tissue ischemia. Dinsdale (3) and Goldstein (4) determined that swine develop pressure ulcers at lower pressures when shear was present. A literature review resulted in two authors reporting interface shear stresses on five surfaces. Bennett (5) measured interface shear stresses near the ischial tuberosity (IT) of healthy young (0.9 kPa) and older (2.6 kPa) subjects while sitting on a rigid plastic wheelchair seat surface. Goossens (6,7) measured interface shear stresses on wood, a foam cushion, a gel cushion and on LiquiCell cushion surfaces with results ranging between 4.1 – 9.6 kPa. Neither of these studies used commercially available shear sensors.
Cushion manufacturers routinely incorporate shear reduction technologies into cushion designs, but without shear quantification, the designers are left without a valid means to evalute their products and practitioners are left without a basis for clinical decision making. Large shear magnitudes occlude blood flow (8) and negligible shear magnitudes could result in the users sliding out of the wheelchair. This study quantifies interface shear stresses of commercial cushions.
RESEARCH QUESTION
The objective of this study was to quantify interface shear stresses of commercial wheelchair seat cushions and to determine if relationships exist between the horizontal stiffness of a cushion and the interface shear stress.
METHODS
Shear characteristics of eight wheelchair seat cushions (Table 1) were obtained using a loading jig. The loading jig applies independent vertical and horizontal forces to cushions through a Rigid Cushion Loading Indenter (RCLI). The RCLI is a rigid buttock approximating human anatomy. Use of such a jig is preferred over using human subjects because it reduces variability (9). Cushions were positioned under the RCLI such that the protrusions representing the ischial tuberocities (ITs) were 125 mm ± 25 mm forward the back edge of the cushion. Cushions were preconditioned (two applications of 830 N ± 10 N for 150 seconds) and allowed a recovery time of 5-60 minutes. A standard hospital sheet was placed over the cushion to provide a means to control the coefficient of friction across different cushions. A normal load of 500 N ± 10 N was applied and within 60 s a horizontal displacement was applied at a constant rate (2 mm/s) and held for 120 seconds. Three displacements (10, 15 and 20 mm) were applied to each cushion, five times each. The RCLI displacement, interface pressure, interface shear force and horizontal force were recorded at 60 and 120 seconds. RCLI displacement is the horizontal displacement of the RCLI measured with a digital indicator (Swiss Precision Instruments, Inc., USA), interface pressure and interface shear force are the mechanical forces at the RCLI-cushion interface measured with a pressure and shear force sensor placed under the left IT of the RCLI (Predia, Molten Corp., Japan), and horizontal force is the resulting force from the applied horizontal displacements measured with a load cell (MTS Systems Corp., USA). The interface shear stress values were calculated by dividing the interface shear force by the shear sensing area (28.14 cm2). Cushions were adjusted (i.e. setup) to accommodate applied loads and reset after each trial as applicable.
Cushion |
Size (WidthxDepthxThickness) |
Manufacturer |
HCPCS Category |
|---|---|---|---|
HR32 open-cell polyurethane foam |
18”x16”x4” |
N/A |
Non-coded |
HR45 open-cell polyurethane foam |
18”x16”x4” |
N/A |
Non-coded |
HR70 open-cell polyurethane foam |
18”x16”x3” |
N/A |
Non-coded |
HR2855 open-cell polyurethane foam |
18”x16”x3” |
N/A |
Non-coded |
Vicair Adjuster 10 |
16”x18” |
Vicair BV, The Netherlands |
Adjustable Skin Protection (K0734) |
Jay J2 2100A |
18”x16” |
Sunrise Medical, USA |
Adjustable Skin Protection (K0734) |
ROHO High Profile Single Compartment Cushion |
16.75”x18.5” |
The Roho Group, USA |
Adjustable Skin Protection (K0734) |
Cross-cut cushion |
18”x16” |
Span America, USA |
General Use (E2601) |
Interface Pressure and Shear Stress
Interface pressure and shear stress were compared across cushions. A one-way ANOVA was used to determine if cushions exhibited significant differences in interface pressure and shear stress. Alpha levels were set at .05 a priori.
Shear Characteristics
Force-displacement and shear-force-displacement curves were constructed for each cushion by plotting the RCLI displacements resulting from the 10, 15 and 20 mm horizontal displacements versus average horizontal force and average interface shear force values, respectively. A linear regression analysis of the force-displacement and shear-force-displacement curves resulted in two horizontal stiffness values: overall and local horizontal stiffness, respectively. Correlation coefficients were calculated to determine the relationship between horizontal stiffness and interface shear stress. Kendall’s tau was used for 10 mm horizontal displacement and Pearson product moment correlation coefficient for 15 and 20 mm horizontal displacements. Analyses were selected based upon an assumed normal distribution of data and alpha levels set at .05 a priori.
RESULTS
Measurements recorded were found to be similar at both 60 s and 120 s, 60 s was chosen for analyses. During testing, the Cross-cut cushion (Span America, USA) did not receive applied displacements 15 and 20 mm because the shear sensor saturated during the first 15 mm displacement trial. The reason for the large shear stress is most likely because the RCLI bottomed out (cushion was fully compressed and the rigid surface below supported the load). Statistical analyses were performed using the seven remaining cushions.
Interface Pressure and Shear Stress
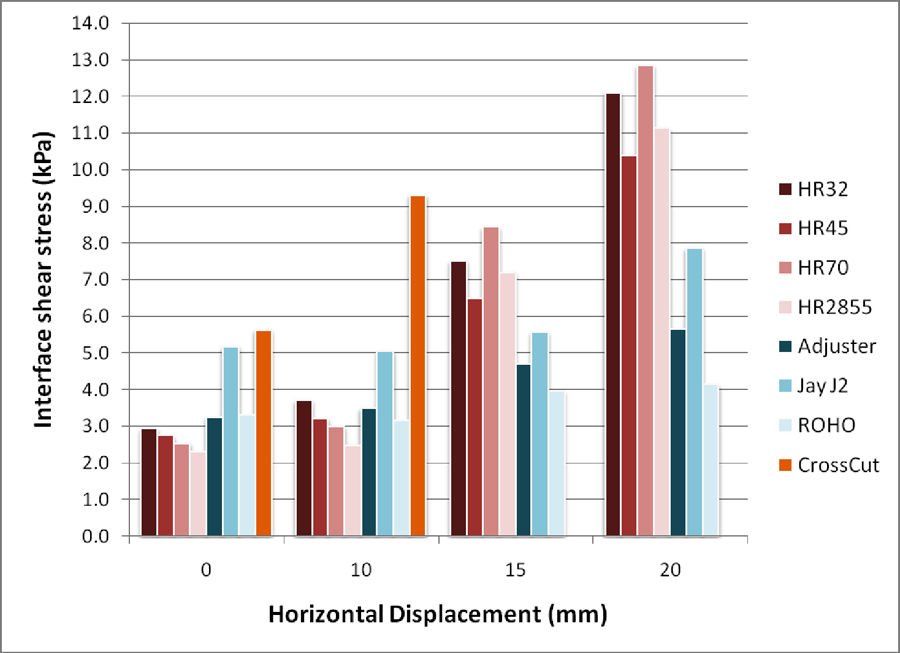 Figure 1: Average interface shear stresses of eight cushions at 0, 10, 15 and 20 mm horizontal displacement d (Click for larger view)
 Average interface pressure and shear stress values for 20 mm horizontal displacement are tabulated in Table 2. The one-way ANOVA revealed significant differences in pressure (p<.001) and shear (p<.001) between cushions. Games-Howell and Scheffe posthoc analyses were used for pressure and shear stress, respectively, based upon the assumption of homogeneity of variance. The ROHO interface pressures were significantly less than all cushions (p<.041), and HR32 open-cell polyurethane foam interface pressures were significantly greater than all cushions (p<.016) except HR45 (p=.995). The ROHO interface shear stresses were significantly less than all cushions (p<.001), and HR70 open-cell polyurethane foam interface shear stresses were significantly higher than all cushions (p<.013) at the left IT. Average interface shear stresses for all horizontal displacements are shown in Figure 1.
Cushion |
Interface Pressure (mmHg) |
Interface Shear Stress(kPa) |
Overall Horizontal Stiffness (N/mm) |
Local Horizontal Stiffness (N/mm) |
|---|---|---|---|---|
HR32 |
100.4 ± 2.07 |
12.1 ± .18 |
11.61 (R2=.97) |
3.05 (R2=1.00) |
HR45 |
97.6 ± 10.95 |
10.4 ± .20 |
9.72 (R2=.90) |
2.32 (R2=1.00) |
HR70 |
91.0 ± .71 |
12.8 ± .35 |
11.51 (R2=.98) |
3.47 (R2=.99) |
HR2855 |
91.0 ± 1.87 |
11.1 ± .306 |
10.04 (R2=.99) |
3.10 (R2=.99) |
Adjuster |
91.4 ± 3.36 |
5.7 ± .192 |
13.57 (R2=.98) |
1.18 (R2=1.00) |
Jay J2 |
90.4 ± 1.14 |
7.9 ± .36 |
9.25 (R2=.95) |
.96 (R2=.97) |
ROHO |
71.8 ± .84 |
4.1 ± .15 |
8.77 (R2=.97) |
.32 (R2=.85) |
Shear Characteristics
Overall horizontal stiffness, local horizontal stiffness and the respective R-squared values for 20 mm horizontal displacement are tabulated in Table 2. The linear regression analysis resulted in high correlations for horizontal stiffness values. The correlation coefficients are tabulated in Table 3 and revealed no relationships between overall horizontal stiffness and interface shear stress for all displacements, or between local horizontal stiffness and interface shear stress at 10 mm horizontal displacement. A positive correlation was found between local horizontal stiffness and interface shear stress at 15 and (r=.966 / p=.000) and 20mm (r=.960 / p=.001). An additional Pearson’s correlation analysis determined no relationship between the overall horizontal stiffness and horizontal force (-.044 < r < .037).
| Horizontal Displacement | Overall Horizontal Stiffness | Local Horizontal Stiffness |
|---|---|---|
10 |
0.048 |
-0.333 |
15 |
0.188 |
0.966* |
20 |
0.140 |
0.960* |
| *p<.001 | ||
DISCUSSION
The Healthcare Common Procedure Coding System (HCPCS) has established wheelchair seat cushion categories based upon a user’s needs. The four open-cell polyurethane cushions are non-coded, Cross-cut cushion is coded as General Use (E2601) and Adjuster, Jay J2 and ROHO High Profile Single Compartment cushions are coded as Adjustable Skin Protection (K0734). Intuitively, one would expect the highest levels of interface forces associated with non-coded cushions, less from a general use category and the least from the Adjustable Skin Protection category. In fact, the interface shear stresses at 15 and 20 mm horizontal displacement follow this assumed trendas shown in Figure 1. The open-cell polyurethane foam cushions had the highest amount of shear stress; Adjuster, Jay J2 and ROHO High Profile Single Compartment cushions had the least shear stress. Our comparison did not include the General Use cushion because no data was collected at 15 and 20 mm horizontal displacement. Overall, the ROHO cushion had the least amount of interface pressure and least amount of shear stress and HR70 cushion the highest.
ISO 16840-2, Annex C (9) uses similar methodology to determine horizontal stiffness. A single displacement is applied to the RCLI and the resulting horizontal force recorded. A single data point does not provide ample data to construct a force-displacement curve nor a stiffness coefficient. Constructing a line using the single force-displacement data point and a (0,0) data point would imply zero interface shear stress upon a purely vertical load, which is incorrect as shown in Figure 1. This study expanded the methodology to include multiple displacements to construct a force-displacement curve. The linear regression resulted in high correlations and the correlation analysis resulted in no relationship between overall horizontal stiffness and interface shear stress. ISO 16840-2, Annex C (9) states that a cushion with high horizontal stiffness imparts more deformation and shearing to the tissue and a cushion with low horizontal stiffness imparts less deformation and shearing. The results of this study contradict this notion. Additional research on a larger sample of cushions is recommended to determine if a recommendation to modify Annex C is appropriate.
A positive correlation was found between local horizontal stiffness and interface shear stress. Pressure ulcers occur over bony prominences at much higher frequencies than they occur in other areas of the buttock and seat interface. As a result, cushion designs have tended to be non-homogeneous in nature where greater envelopment and lower stiffnesses are provided in areas near the bony prominences. For example, the Jay J2 cushion contains Jay FlowTM fluid at the ITs and closed-cell polyurethane foam at the thighs. Local horizontal stiffness at the thigh would be different from the ITs and not representative of the cushion’s ability to reduce shear stress at these bony prominences.
Interface shear stresses measured in this study ranged between 2.3 – 12.8 kPa. This compares to values in the literature ranging from 0.9 to 9.6 kPa (5-7). The highest stress measurements in our study occured were associated with open-cell polyurethane foam and the highest level stresses in the previous studies was measured on wood. Limitations exist in our ability to compare our values to those from these previous studies due to our reliance on the pressure and shear force sensor’s factory calibration, unknown sensor accuracy and potential erroneous forces created from the sensor itself.
Future research will include configuration of the analog output of the pressure and shear force sensor to collect data at a higher frequency and to establish design specifications to assist cushion designers in reducing shear stress.
REFERENCES
- Brienza, D.M. and M.J. Geyer, Using support surfaces to manage tissue integrity. Advances in Skin & Wound Care, 2005. 18(3): p. 151-7.
- Goossens, R.H., et al., Influence of shear on skin oxygen tension. Clinical Physiology, 1994. 14(1): p. 111-8.
- Dinsdale, S.M., Decubitus ulcers: role of pressure and friction in causation. Archives of Physical Medicine & Rehabilitation, 1974. 55(4): p. 147-52.
- Goldstein, B. and J. Sanders, Skin response to repetitive mechanical stress: a new experimental model in pig. Archives of Physical Medicine & Rehabilitation, 1998. 79(3): p. 265-72.
- Bennett, L., et al., Skin blood flow in seated geriatric patients. Archives of Physical Medicine & Rehabilitation, 1981. 62(8): p. 392-8.
- Goossens, R.H., Shear Stress measured on three different materials. 2001, LiquiCell Technologies, Inc.
- Goossens, R.H., et al., Shear stress measured on beds and wheelchairs. Scandinavian Journal of Rehabilitation Medicine, 1997. 29(3): p. 131-6.
- Bennett, L., et al., Shear vs pressure as causative factors in skin blood flow occlusion. Archives of Physical Medicine & Rehabilitation, 1979. 60(7): p. 309-14.
- International Organization for Standardization (ISO), 2007, Wheelchair seating - Part 2: Determination of physical and mechanical characteristics of devices intended to manage tissue integrity - Seat Cushions, ISO/FDIS 16840-2, Geneva, Switzerland.
ACKNOWLEDGEMENTS
This work was funded by the National Institute on Disability and Rehabilitation Research (NIDRR), Rehabilitation Engineering Research Center (RERC) on Spinal Cord Injury, Grant #H133E070024. This work was also funded in part under The Technology Collaborative (TTC), Grant # 705244. The ideas and opinions expressed herein are those of the authors and not necessarily reflective of the NIDRR and TTC.
Author Contact Information
Jonathan Akins, BS, University of Pittsburgh, 2310 Jane Street Suite 1300, Pittsburgh, PA 15203, Office Phone (412) 586-6917, EMAIL: jsa14@pitt.edu